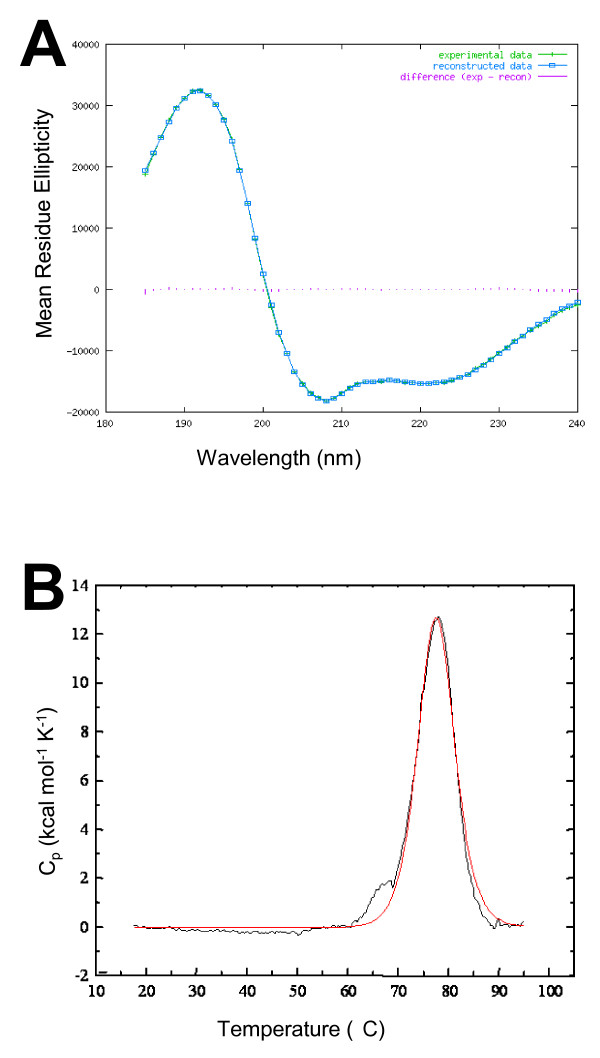
Figure 7.
Structural properties of Pam. (A) Graphical output of far-UV CD data for Pam reveals that experimental data (green crosses) and calculated spectrum (blue boxes), derived from the calculated output secondary structure, show agreement. The difference spectrum (purple lines) is very close to zero throughout the wavelength range, indicating the goodness of fit of the structural predictions. The CD data indicate that Pam is largely helical (58%), with only a small fraction of residues forming β-strands. (B) Thermal stability of Pam measured by differential scanning calorimetry. The normalised thermal transition curve (red line) shows energy uptake by Pam reached a peak (Tm) at 77.4°C, representing the temperature at which 50% of the protein molecules are unfolded. This was almost identical after cooling the sample and repeating (black line).

