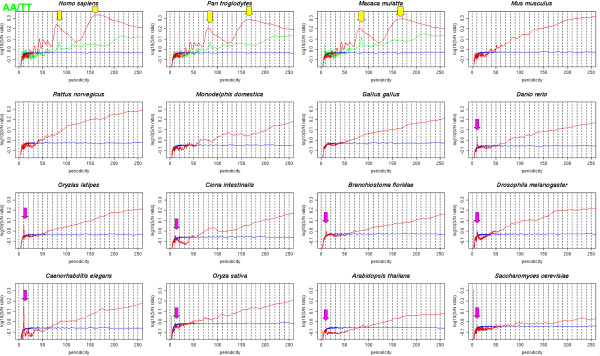
Figure 1.
Strength of the genome-wide periodicity from 2 bp to 250 bp for the AA/TT dinucleotide step. Red, blue, and green lines are drawn from the results for the whole genome, randomly generated DNA, and Alu-masked genome sequences, respectively. Pink arrows represent peaks of 10-bp periodicity, and yellow arrows represent peaks of 84-bp or 167-bp periodicity.

