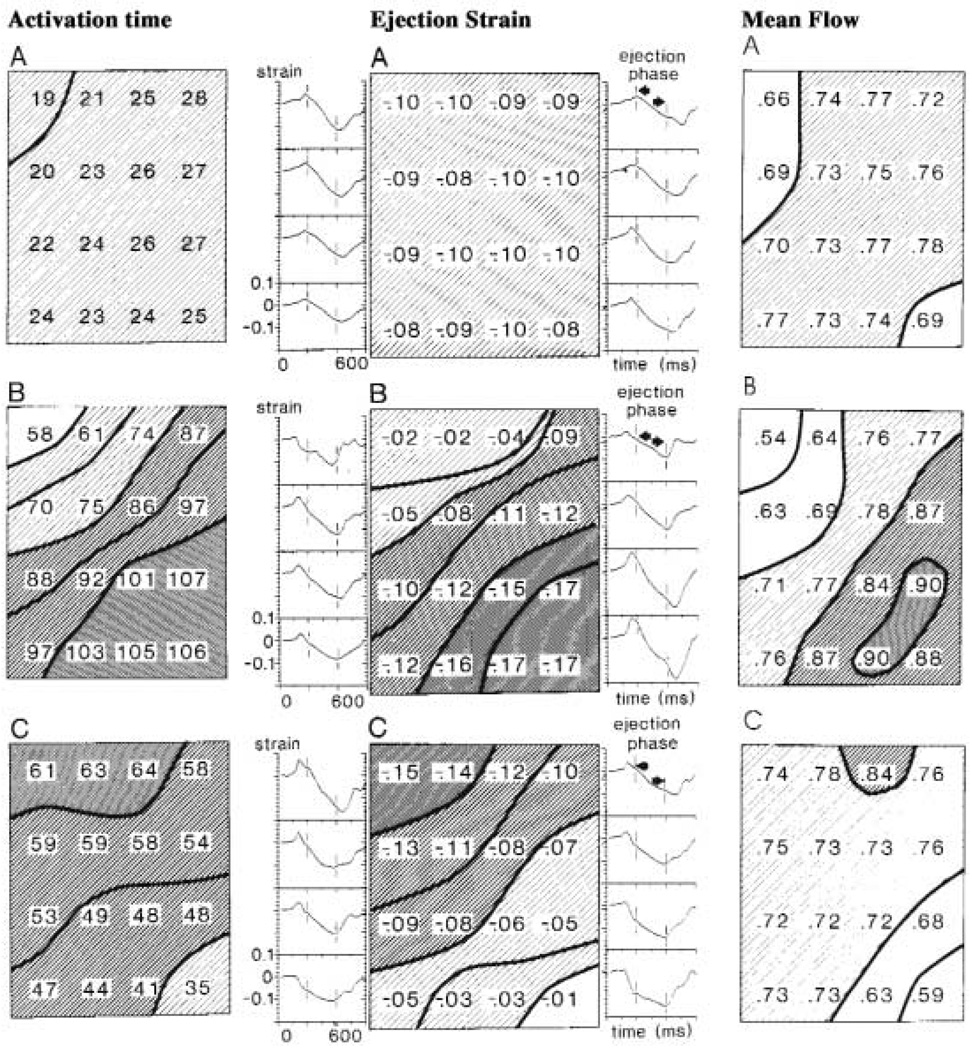
Fig. 5.
Electrical activation, regional shortening patterns and blood flows in a 5 by 4 cm patch of dog LV free wall divided into 16 regions. Upper panels (A): Normal sinus activation. Middle panels (B): RV outflow tract stimulation. Lower panels (C): LV apical stimulation. Left column of panels: Electrical activation times, ms. Middle column: Strains (fractional length changes) during systolic ejection phase are shown numerically, negative sign indicating shortening; to the sides are continuous recordings of the regional segment lengths between epicardial markers. Pre-ejection negative strain → shortening deactivation. Right column: rMBF values in underlying myocardium by the microsphere technique. (Composite figure made from various figures of (75), with permission.)

