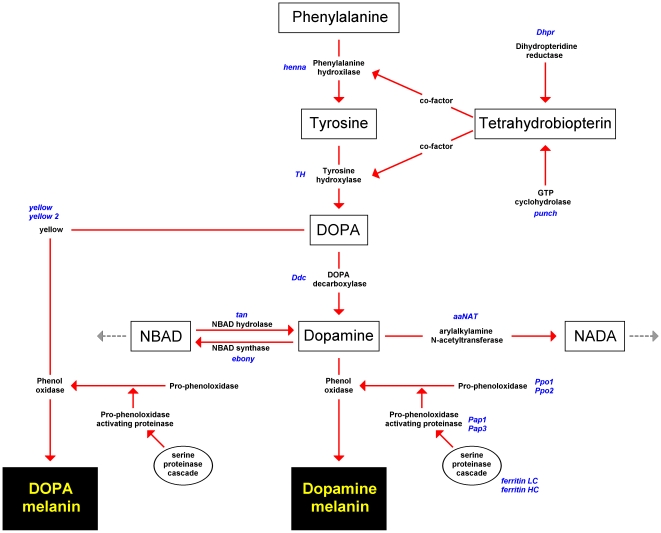
Figure 1. Insect melanisation biochemical pathway.
The initial substrate, intermediate metabolites and two types of melanin are shown in rectangles. The enzymes that catalyze the different reactions are in black and the genes that code for these enzymes are italicized in blue. The genes in this figure correspond with the candidate genes that have been isolated and examined. The serine proteinase cascade is represented as a single cluster of events. A more comprehensive representation of this cascade is produced in Cerenius and Söderhäll [8]. The interrupted arrows pointing away from NBAD and NADA indicate that these are not the final metabolites. (Figure adapted from De Gregorio et al., True, and Futahashi & Fujiwara [16], [17], [20]).

