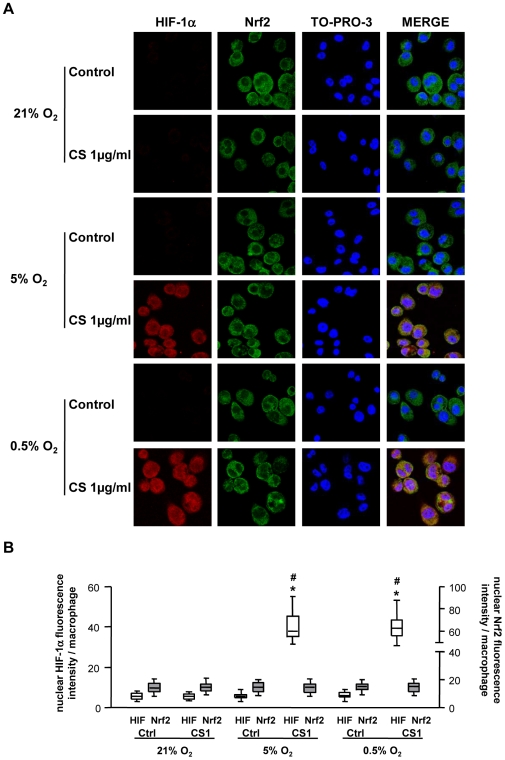
Figure 9. Expression of HIF-1α and Nrf2 protein in THP-1 cells at 4 h reoxygenation.
HIF-1α and Nrf2 protein expression in THP-1 cells exposed to normoxic (21% O2) or hypoxic (5% and 0.5% O2) conditions and 1 µg/ml CS or DMSO (Ctrl) 4 h after reoxygenation (R4) was assessed by confocal laser microscopy analysis. A: Immunofluorescent staining involved HIF-1α (in red: left column), Nrf2 (in green) and TO-PRO-3 DNA (blue). Co-expression is seen by overlays (Merge column). B: Quantification of nuclear HIF-1α and Nrf2 immunofluorescence in THP-1 cells at R4. (magnification ×1200). Box-and-whiskers plot with median, interquartile range and minimum and maximum values. * p<0.0001 vs. Ctrl and # p<0.0001 vs. 21% O2.

