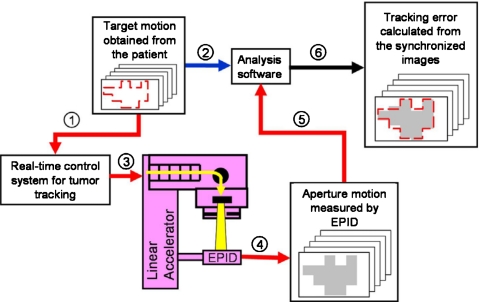
Figure 1.
Schematic flow diagram for the VORTE. Step 1: The designed-target (target in this study is defined as the targeted area to be treated) motion is used as an input to the real-time control system. Step 2: The same target motion is used as an input to the analysis software. Step 3: Real-time tracking is simulated by positioning the MLC leaves to compensate for the target motion. Step 4: The EPID in the continuous-acquisition mode takes sequential images of the moving apertures controlled during the real-time tracking. Step 5: These sequential images of the aperture motion are used as inputs to the analysis software. Step 6: The analysis software compares the target and aperture motions to evaluate the accuracy of the real-time tracking.

