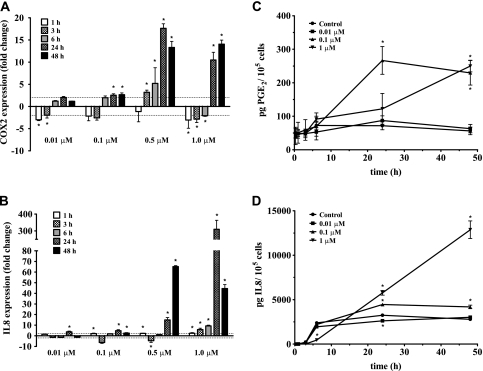
Fig. 2.
Time–response and dose–response of mRNA and extracellular levels of COX2/PGE2 and IL8 in WI-38 cells. (A and B) Fold changes in expression of COX2 and IL8 determined by RT2–PCR, respectively. The dashed line represents a 2-fold change. Results are represented as mean ± SD; experiments were performed at least twice in duplicates. *P < 0.05 and ≥2-fold change compared with vehicle control by Student's t-test. (C and D) Extracellular levels of PGE2 and IL8 determined by ELISA, respectively. Results are represented as mean ± SD, n = 3. *P < 0.05 compared with vehicle control by Student's t-test.

