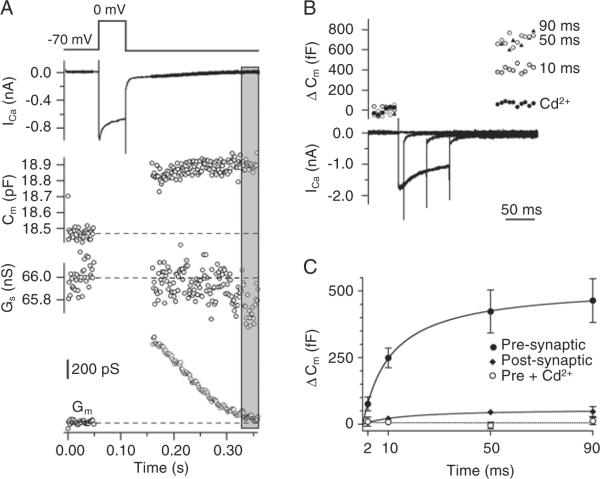
Figure 1.
Measuring exocytosis using membrane capacitance changes in p8–10 rats. The internal Ca2+ buffer was 0.2 mM EGTA. A, Changes of membrane capacitance (Cm), series conductance (Gs) and membrane conductance (Gm) evoked by a 90-ms Ca2+ current (top trace). The area in the gray rectangle shows the time window used to measure membrane capacitance. B, Example of the response to presynaptic Ca2+ currents evoked by a depolarization to 0 mV of 10-, 50- and 90-ms duration. In the presence of 100 μM CdCl2, no Ca2+ current or capacitance jump was detected. C, The average capacitance jumps from 10 synapses (means ± SEM). Presynaptic cell (control conditions; filled circles); presynaptic cell in the presence of CdCl2 (0.1 mM; open circles), postsynaptic cell (lozenges). The curves are fit to a square hyperbolic function.

