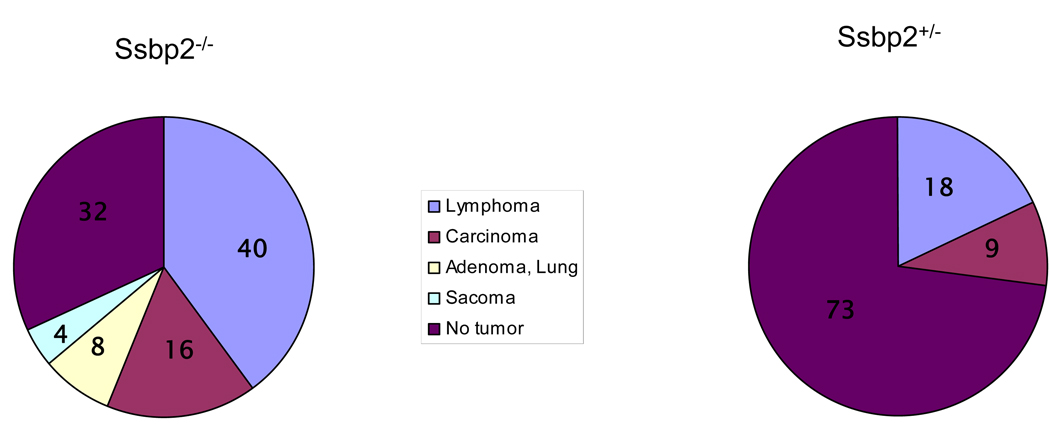
Figure 2. Tumor spectrum in Ssbp2 null mice.
A) Pie chart depicts relative incidence of malignancies seen in Ssbp2−/− mice. A total of 14 tumors from 25 mice ( Supplementary Table II) was used to determine the frequencies. B) Eleven age matched Ssbp2+/− mice were sacrificed for total necropsy. Three malignancies were found in two mice. Numbers inside each slice denote the percentage of specific tumor type.

