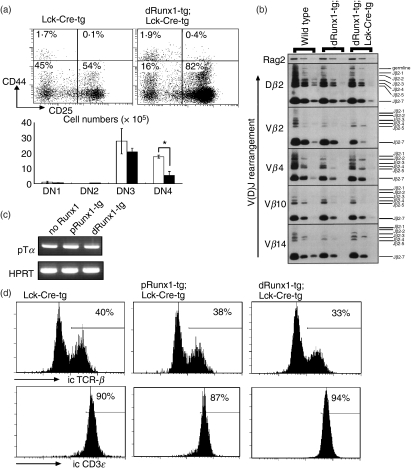
Figure 4.
Effects of Lck-driven Runx1 over-expression on double-negative (DN) thymocyte differentiation. (a) Sub-staging of DN thymocyte differentiation. Thymocytes from distal Runx1-tg;Lck-Cre-tg (closed bars) and Lck-Cre-tg mice (open bars) were processed for flow cytometric analysis of CD4/CD8, Thy-1.2, CD44 and CD25. The data shown here were gated for the Thy-1.2+ CD4− CD8− fraction that represents authentic, DN T lymphocytes. Sub-staging of DN cells was based on the levels of CD44 and CD25 expression. The representative expression profiles are shown as well as the mean ± SD values (n = 3) of the absolute number of cells at each DN sub-stage. Significances of difference were statistically tested by Student’s t-test, and if detected between the compared genotypes, they are indicated by a bracket with *(P < 0·05). (b) Detection of TCRβ gene recombination in DN thymocytes. The DN3 subset of cells was purified by cell-sorting from C57BL/6 (wild-type), distal Runx1-tg and distal Runx1-tg;Lck-Cre-tg mice, and genomic DNA was prepared. Polymerase chain reaction (PCR) was performed using different amounts of template DNA and specific oligonucleotides as primers. PCR products were processed for Southern blot analysis. The patterns of V(D)J recombination detected are as indicated. Rag2 served as a control. (c) Expression of pTα in thymocytes. RNA was prepared from total thymocytes, and processed for reverse transcription-PCR. Transcripts representing pTα and HPRT were amplified. (d) DN3 subset was purified from thymocytes, stained for intracytoplasmic T-cell receptor-β (TCR-β) and CD3ε and processed for flow cytometric analysis. Numbers indicate the proportions of TCR-β+ and CD3ε+ cells in each DN3 subset.

