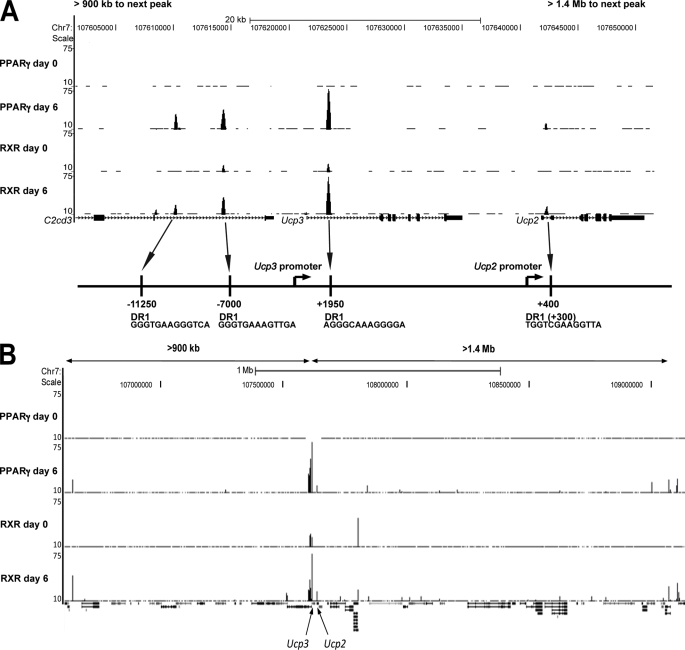
FIGURE 2.
PPARγ/RXR ChIP-seq profile of the Ucp2 and Ucp3 loci. Screen shots from the genome-wide ChIP-seq profile of PPARγ/RXR binding sites in 3T3-L1 cells by Nielsen et al. (40) on days 0 and 6 of differentiation. A, close-up of the murine Ucp2 and -3 loci with a schematic representation indicating the positions of the PPARγ/RXR binding sites and DR1 elements relative to the transcription start sites shown below. B, overview of the PPARγ and RXR binding profiles on >2.3 Mb of chromosome 7 encompassing the Ucp2 and -3 genes. The genomic distances to the neighboring PPARγ/RXR binding sites relative to the sites in the Ucp3 and -2 locus are indicated.

