FIGURE 2.
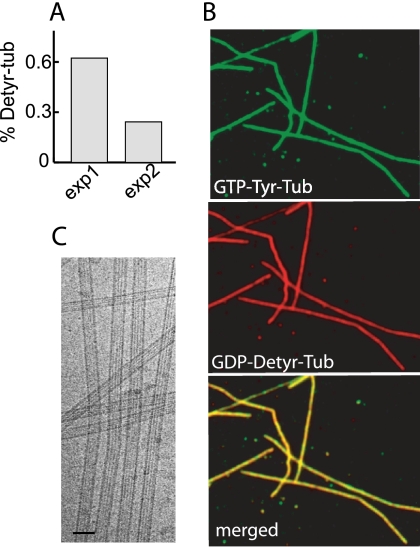
Visualization of GDP-tub incorporation into microtubules. A, microtubules were assembled from GTP-Detyr-tub (70 μm) and GDP-Tyr-tub (50 μm) (exp1) or from GTP-Tyr-tub (70 μm) and GDP-Detyr-tub (50 μm) (exp2). Microtubule composition at the time of maximum assembly was analyzed on immunoblots (supplemental Results). The histogram shows the percentage of Detyr-tub in microtubules. B, light microscopy examination of microtubules assembled from GTP-Tyr-tub and GDP-Detyr-tub during 10 min at 35 °C in PEM buffer. The bottom panel shows superposition of both images. C, cryo-electron microscopy images of the microtubules assembled from GTP-tub (75 μm) and GDP-tub (120 μm).

