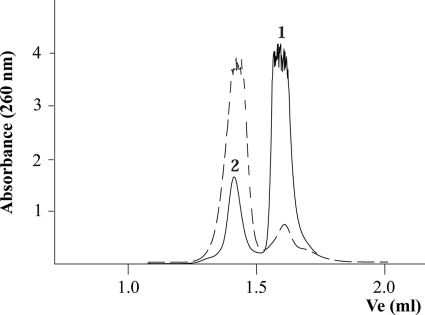
FIGURE 2.
Conversion of free oligonucleotide B to a G4 DNA structure. Oligonucleotides were chromatographed at 20 °C at a flow rate of 30 μl/min on a Superdex-200 PC 3.2/30 column (Amersham Biosciences SMART system). The column was equilibrated in buffer containing 50 mm Pipes-NaOH (pH 6.2), 150 mm NaCl, 0.1 mm EDTA, 10% glycerol, and 0.001% PMSF. Absorbance was monitored at 260 nm. Ve represents the elution volume. The figure shows the elution profile of the 45-mer oligonucleotide B without pretreatment (represented as a solid line) and the same oligonucleotide incubated for 48 h in the presence of 150 mm Na+, as described under “Experimental Procedures” (represented as a dashed line). Peaks were interpreted as follows: 1) free oligonucleotide and 2) oligonucleotide with a G4 DNA secondary structure.

