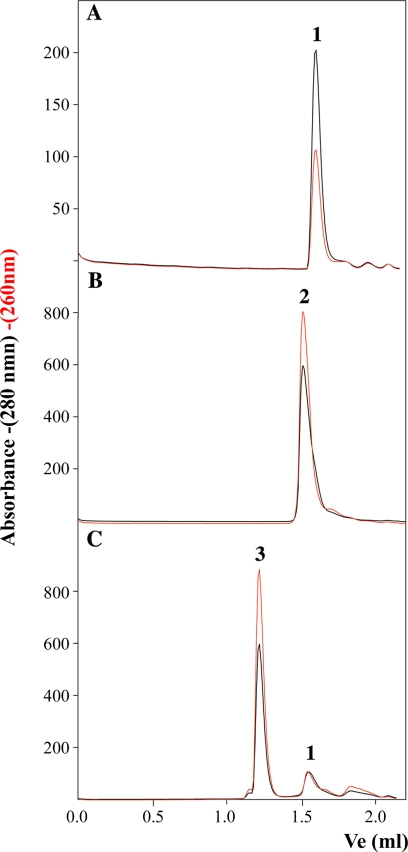
FIGURE 4.
Gel filtration chromatography of TrwBΔN70 and TrwBΔN70-DNA complexes. Protein samples (60 μm) were preincubated with oligonucleotides A and B (10 μm) and chromatographed at 20 °C at a flow rate of 30 μl/min on a Superdex-200 PC 3.2/30 column (Amersham Biosciences SMART system). The column was equilibrated in buffer containing 50 mm Pipes-NaOH (pH 6.2), 150 mm NaCl, 0.1 mm EDTA, 0.001% PMSF, and 10% glycerol. Absorbance was monitored at 280 nm (black) and 260 nm (red). Ve represents the elution volume. Elution profiles are as follows: A, TrwBΔN70; B, TrwBΔN70 preincubated with oligonucleotide A; and C, TrwBΔN70 preincubated with oligonucleotide B previously treated to form a G4 DNA structure. Peaks were interpreted as follows: 1) free protein (relative lack of absorbance at 260; apparent molecular mass ∼50 kDa); 2) slow complex (contains protein and DNA; apparent molecular mass ∼100 kDa); and 3) fast complex (contains protein and DNA; apparent molecular mass ∼440 kDa).

