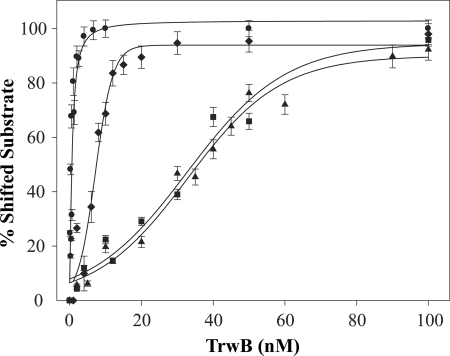
FIGURE 6.
Quantification of representative gel mobility shift analyses of TrwBΔN70 binding to G4 DNA (●), forked DNA (♦), ssDNA (■), and dsDNA (▴). Apparent affinities (Kd) are 0.3, 7, 31, and 33 nm, respectively. Experiments were carried out as described in the legend for Fig. 5. Error bars represent S.D. from three experiments.

