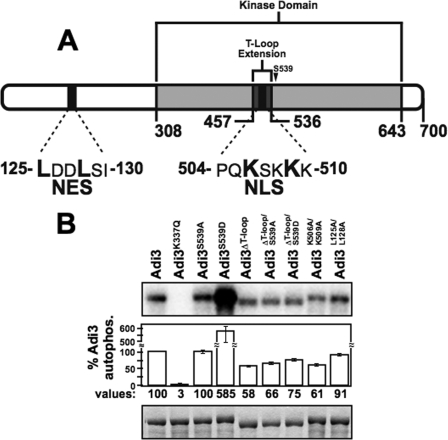
FIGURE 1.
T-loop extension deletion effects on autophosphorylation activity of Adi3. A, Adi3 protein domains showing location of the T-loop extension and NLS and NES signals. B, kinase activity of Adi3 mutants tested by in vitro autophosphorylation assays. MBP-tagged proteins were expressed en E. coli, purified, and 5 μg of each protein incubated with [γ-32P]ATP in an in vitro kinase assay. Quantification software was used to normalize the autophosphorylation level to the protein levels for each sample. Values are reported as a percentage of wild-type Adi3 autophosphorylation and are the average of three independent experiments. Error bars are standard error. Top panel: kinase assay (phosphorimage). Bottom panel: assay input (Coomassie Blue-stained gel).

