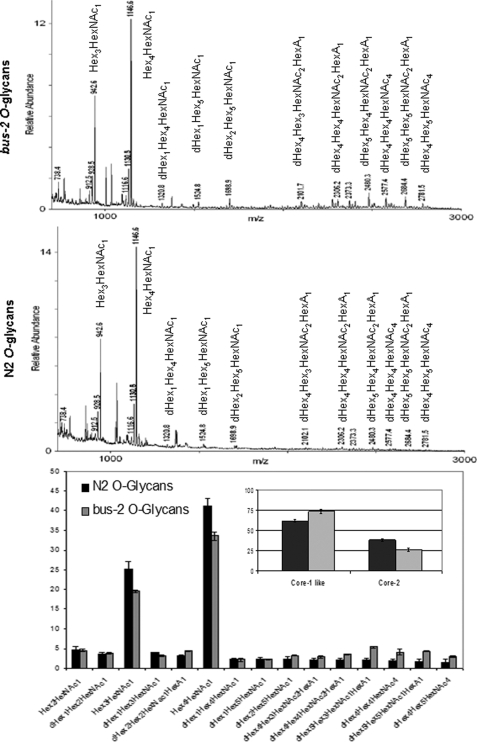
FIGURE 3.
Permethylation profiles of bus-2 and N2 Bristol O-glycans. MALDI-TOF MS spectra of the permethylated O-glycans released from bus-2 and N2 Bristol and eluted under low salt conditions from anion exchange resin are shown in the top and center panels. Ion abundances for each composition are shown in the lower panel. The inset shows total Ce core-1 and Ce core-2 O-glycans. Error bars indicate S.D. over three analyses.

