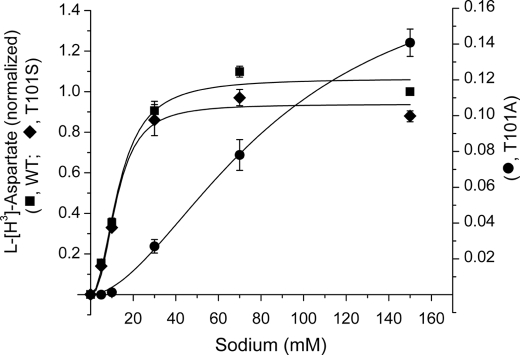
FIGURE 3.
Sodium concentration dependence of l-[3H]aspartate transport. The rates of transport of EAAC1WT (squares), EAAC1T101S (diamonds), and EAAC1T101A (circles), expressed in HeLa cells, on the sodium concentration were measured as described under “Experimental Procedures” after subtraction of the values for HeLa cells transfected with the vector alone. All of the values, including those of the T101A mutant (right ordinate; note the different scale caused by the lower uptake of the mutant), are normalized to those of EAAC1WT at 150 mm NaCl and are the averages ± S.E. of three different experiments each done in quadruplicate.

