FIGURE 8.
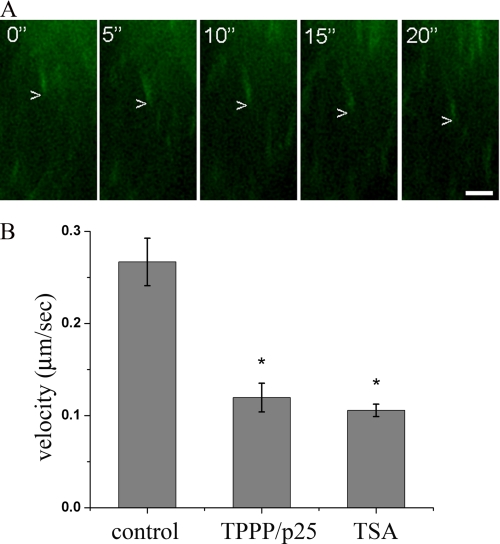
TPPP/p25 decreases microtubule growth velocity. Shown is the overlap of four successive time lapse images of EB3-GFP taken at 5-s intervals representing the displacement of EB3-GFP as a moving comet tail in a control HeLa cell. Scale bar, 2 μm (A). The microtubule growth velocity of the DsRed2-TPPP/p25-expressing cells and TSA-treated cells decreased when compared with control cells. The TPPP/p25-decorated or TSA-treated microtubules grew about 2 times more slowly than the microtubules of the control cells (B). The error bars represent S.E. n (control) = 6, n (TPPP/p25) = 10, n (TSA) = 17. *, significant difference between TSA-treated or TPPP/p25-expressing cells and control cells (according to Student's t test, p < 0.05).

