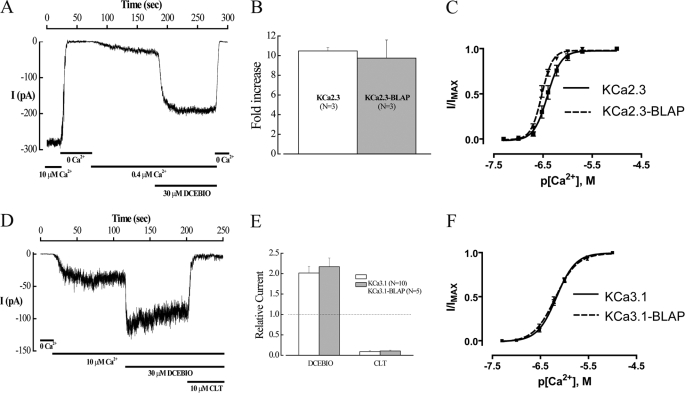
FIGURE 1.
Insertion of the BLAP sequence into the 2nd extracellular loop of KCa2.3 and KCa3.1 does not affect channel function. A, inside-out patch clamp recording at a holding potential of −100 mV in symmetric K+ of BLAP-tagged KCa2.3 from HEK cells. Changing free bath Ca2+ from 10 μm to Ca2+-free and back to 0.4 μm caused the channel to close and then activate as expected. Subsequent addition of DCEBIO (30 μm) caused a further increase in channel activity, which was eliminated in 0 Ca2+. B, average fold-increase in response to DCEBIO (30 μm) for KCa2.3 and BLAP-tagged KCa2.3. No significant difference in responses was observed. C, Ca2+ concentration-response curves for KCa2.3 (solid line) and BLAP-tagged KCa2.3 (dashed line). The data were fitted to the Hill equation to determine K0.5 and Hill coefficients (n). KCa2.3 had a K0.5 of 416 ± 42 nm with an n of 3.8 ± 0.3 (n = 8), whereas BLAP-tagged KCa2.3 had a K0.5 of 302 ± 18 nm with an n of 4.6 ± 0.4 (n = 9). D, inside-out patch clamp recording at a holding potential of −100 mV in symmetric K+ of BLAP-tagged KCa3.1 from HEK cells. Changing from 0 Ca2+ to 10 μm caused the channel to activate as expected. Subsequent addition of DCEBIO (30 μm) caused a further increase in channel activity, which was blocked by clotrimazole (CLT, 10 μm). E, average relative current response to DCEBIO and clotrimazole for KCa3.1 (open bars) and BLAP-tagged KCa3.1 (shaded bars). No significant difference in responses was observed. F, Ca2+ concentration-response curves for KCa3.1 (solid line) and BLAP-tagged KCa3.1 (dashed line). The data were fitted to Equation 1 as shown under the “Experimental Procedures” to determine K0.5 and Hill coefficients (n). KCa3.1 had a K0.5 of 679 ± 35 nm with an n of 2.3 ± 0.2 (n = 9), whereas BLAP-tagged KCa2.3 had a K0.5 of 653 ± 48 nm with an n of 2.0 ± 0.1 (n = 9).

