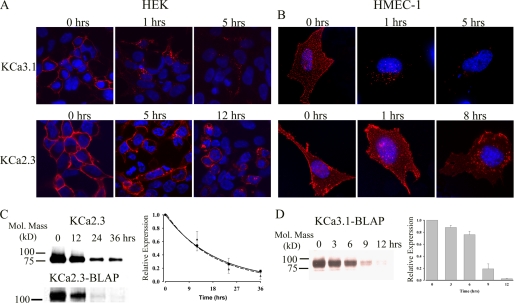
FIGURE 2.
Time course for internalization and degradation of plasma membrane-localized KCa2.3 and KCa3.1 in HEK and HMEC-1 cells. HEK (A) or HMEC-1 (B) cells expressing either BLAP-tagged KCa3.1 (top panels) or KCa2.3 (bottom panels) were labeled with streptavidin-Alexa555, and localization was evaluated at the time points indicated. At time 0 h, both KCa3.1 and KCa2.3 were localized exclusively to the plasma membrane. After 1 h at 37 °C, nearly all of the KCa3.1 had been endocytosed, and after 5 h significant channel was degraded as evidenced by the reduced fluorescence signal. In contrast, KCa2.3 remains at the plasma membrane for an extended period of time, and even after 8 (B) or 12 (A) h, a significant channel is observed in both the plasma membrane as well as in an endosomal compartment. Nuclei are labeled with DAPI (blue). HEK cells are shown as single confocal sections, whereas HMEC-1 cells are shown as projection images from multiple z-sections. C, to quantify the time course for plasma membrane KCa2.3 degradation in HEK cells, we either randomly biotinylated plasma membrane proteins using EZ-Link Sulfo-NHS-SS-Biotin (upper blot) followed by streptavidin pulldown and blotted for KCa2.3 or specifically biotinylated BLAP-tagged KCa2.3 using BirA (lower blot), labeled with streptavidin, and then blotted for streptavidin at time 0, 12, 24, or 36 h at 37 °C (see “Experimental Procedures”). In the latter case, 20 μg of total protein was loaded per lane. Note that the channel runs at a different apparent molecular mass for these two conditions because of the addition of streptavidin in the lower blot. Blots were quantified by densitometry and fit to an exponential decay function with time constants of 18.9 ± 0.2 h (n = 3) for KCa2.3 (solid line, circles) and 17.5 ± 1.1 h (n = 3) for BLAP-tagged KCa2.3 (dashed line, triangles). D, degradation of plasma membrane-localized BLAP-tagged KCa3.1 was quantified in HEK cells by specifically biotinylating using BirA. Following labeling, the cells were returned to 37 °C for 0, 3, 6, 9, or 12 h, as indicated for the representative blot shown in the left panel. 20 μg of total protein was loaded per lane. The data were quantified by densitometry and plotted as shown. KCa3.1 protein levels initially decayed slowly and then exhibited rapid degradation between 6 and 12 h (right panel, n = 3).

