FIGURE 3.
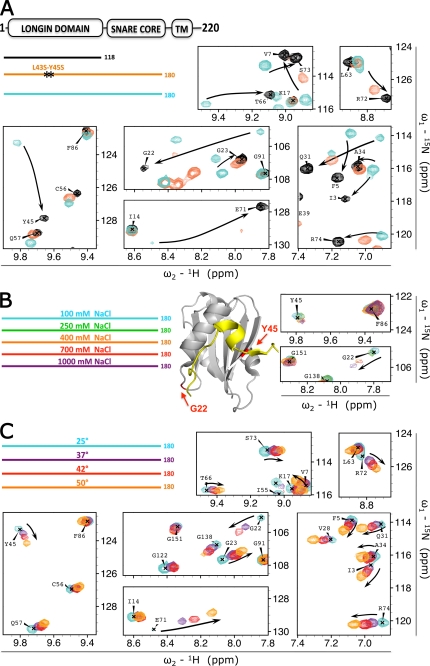
Stability of the VAMP7 closed conformation. A, effect of different 15N-labeled recombinant constructs: VAMP7(1–118) (black), VAMP7(1–180)-L43S/Y45S (orange), and VAMP7(1–180) (cyan). The color-coded bar diagram in the top left corner indicates the boundaries of these three constructs for which the spectra are shown with respect to the domain architecture of full-length VAMP7, residues 1–220: LD, SNARE core domain, and transmembrane domain (TM). Black stars on the orange bar represent the L43S/Y45S point mutations. An overlay of the 1H{15N}-HSQC spectra of these proteins is shown with matching colors for seven representative regions of the spectra. Black arrows indicate resonance perturbation trends from closed to open conformation. B, effect of ionic strength on 15N-labeled VAMP7(1–180) in 100 mm NaCl (cyan), 250 mm NaCl (green), 400 mm NaCl (orange), 700 mm NaCl (red), and 1000 mm NaCl (purple) (legend in top left corner). Two red arrows on the ribbon diagram point to the position of residues Gly-22 and Tyr-45 in the LD (gray) as found in the crystal structure of VAMP7 LD in complex with the Hrb136–176 fragment of the protein (yellow) (PDB ID 2VX8) (32). The 1H{15N}-HSQC resonances for these 2 residues at the five saline conditions are superimposed and shown on the right with colors matching the legend. C, effect of temperature on 15N-labeled VAMP7(1–180). Spectra were acquired at 25 °C (cyan), 37 °C (purple), 42 °C (red), and 50 °C (orange) (legend in top left corner). An overlay of the 1H{15N}-HSQC spectra of VAMP7(1–180) at these temperatures is shown with the same spectral regions of panel A to illustrate the opposite shift perturbation trend (from closed toward open state) indicated by the black arrows.

