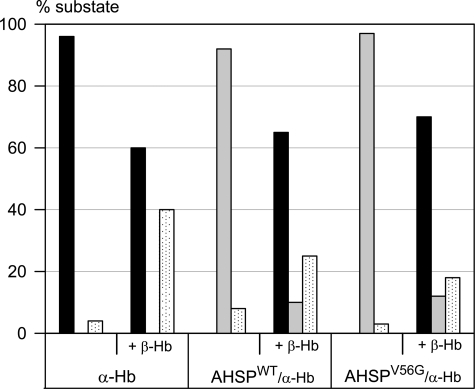
FIGURE 2.
Fraction of the ligand-rebinding phases R (black bars), I (gray bars), and T state (dotted white bars), after photodissociation of CO. Protein concentrations were 10 μm. The isolated α-Hb (left) shows a single phase typical of monomers, dimers and R state Hb tetramers with a rate of 6 μm−1 s−1; after addition of β-Hb chains, one observes two phases characteristic of the allosteric R and T states of tetrameric α2β2 Hb, with rates 6 μm−1 s−1 and 0.2 μm−1 s−1, respectively. The AHSPWT·α-Hb complex (center) shows a single phase for an intermediate form I with a rate of 2 μm−1 s−1, three times lower than for the isolated α-Hb, as reported previously (7). The kinetics for the AHSPV56G·α-Hb complex (right) were similar to those obtained with the WT complex; in both cases, addition of β-Hb leads to a loss of the I state and an increase in the usual R and T states of tetrameric Hb.

