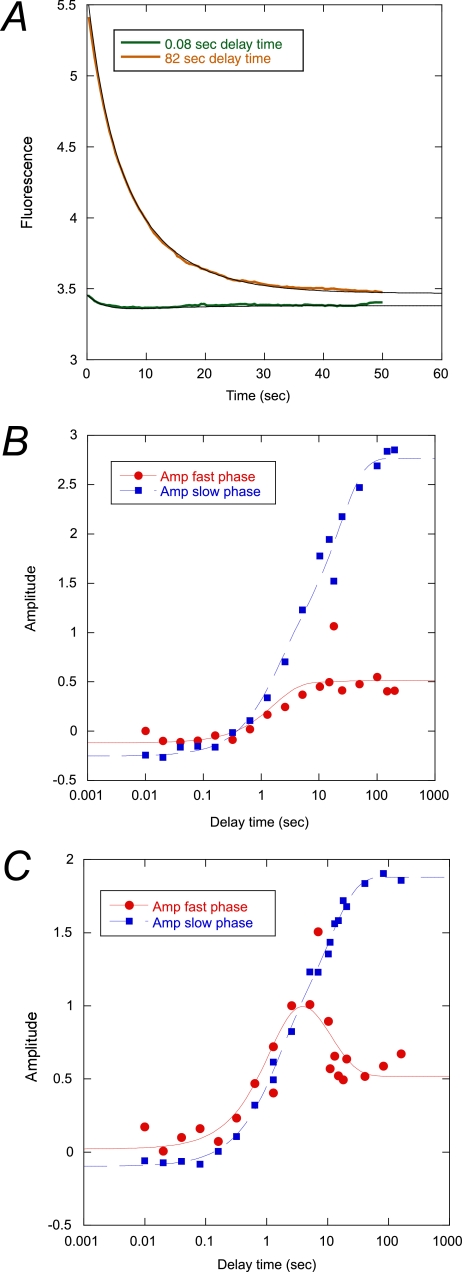
FIGURE 4.
Interrupted refolding experiments. A, example of experimental traces at short and long delay times at 37 °C. Amplitudes of the traces were plotted against delay time at 25 (B) and 37 °C (C). Briefly, acid denatured protein in 10 mm sodium formate was mixed with a buffer-urea solution to a final concentration of 1 m urea in 50 mm potassium phosphate, pH 7.5. After a certain delay time (plotted on the x axis), the refolding reaction was subjected to a second buffer jump to a final concentration of 4.5 m urea in 50 mm potassium phosphate, pH 7.5. The resulting unfolding traces were fitted to a double exponential function with shared rate constants at the respective temperature (0.33 and 0.12 s−1 at 37 °C and 0.063 and 0.016 s−1 at 25 °C). The two amplitudes thus obtained were plotted against the delay time. These data were in turn fitted to a double exponential function (solid lines). See Table 4 for best fit parameters.

