
Fig. 2.
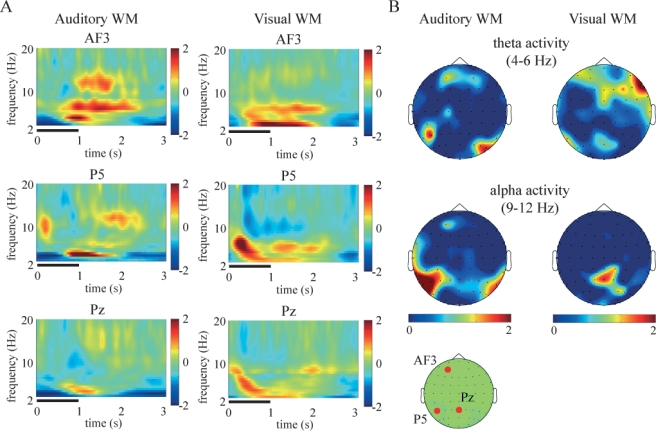
(A) Subject-averaged (N = 14) time–frequency amplitudes of the AF3 (top), P5 (middle) and Pz (bottom) electrodes during the manipulation periods under the auditory (left) and visual (right) working memory (WM) tasks. These values, normalized with respect to the inter-trial interval baseline, were averaged across the correct trials of all participants. The thick horizontal lines indicate the presentation of manipulation instructions. (B) Topographic colored scalp maps of the theta (4–6 Hz, top) and alpha (9–12 Hz, middle) amplitudes for 1–2 s from the onset of each manipulation period during the auditory (left) and visual (right) WM tasks. The drawing shows the top view of the scalp. The bottom panel shows the AF3, P5 and Pz electrodes on the recording montage.