
Fig. 3.
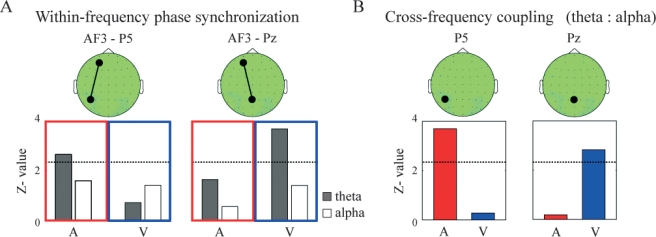
(A) The z-values of the within-frequency phase synchronization index (PSI) between AF3 and P5 (left) and between AF3 and Pz (right) during the manipulation periods in comparison with the ITI under the auditory (A) and visual (V) working memory (WM) conditions. The gray and white bars indicate the z-values of the theta and alpha synchronizations, respectively. (B) The z-Values of the cross-frequency PSI between the theta and alpha phases at P5 (left) and Pz (right) for the manipulation periods in comparison with the ITI under the auditory (A) and visual (V) WM conditions. The dotted lines in each panel denote the threshold value (P < 0.01).