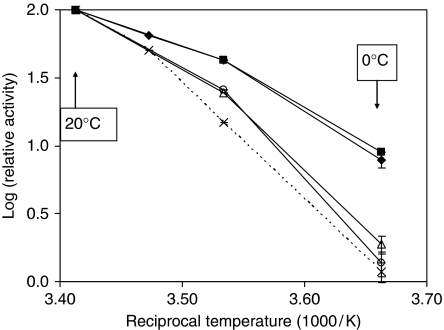
Fig. 2.
Arrhenius plots of maltose transport by the lager strains A15(♦) and A24(▪), ale strains A179(○) and A60(Δ) and the strain Integrant 1 (×). For each data set, rates are expressed as percentages of the rate at 20°C. Absolute rates (μmol min−1 g−1 dry yeast at 20°C) varied between 12 and 27 for A15, A24, A60 and A179 and between 2 and 4 for Integrant 1. Results at 0°C are means±SDs for A15 (n=4) and A60 (n=3) and means±ranges of independent duplicates for A179 and Integrant 1.

