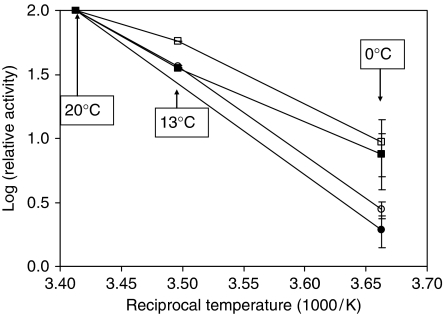
Fig. 3.
Arrhenius plots of maltose transport by Mtt1 and Malx1 transporters. Maltose transport was measured using S150-2B transformed with MTT1 (□, ▪) or MALx1 (○, •). The maltose concentration in the transport assay was 5 mM (□, ○, •) or 50 mM (▪) and transformants were harvested during growth on glucose (at OD600 nm of 3–5; □, ▪, ○) or in the stationary phase (OD600 nm of 10; •). Rates at 13 and 0°C are expressed as percentages of the rate at 20°C. Values at 0°C are (□, ○) means±SDs (n=4 or 5) or (▪, •) means±ranges of duplicate experiments.

