
Figure 4.
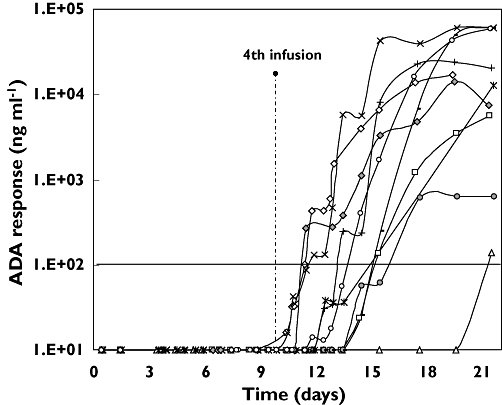
Anti-drug antibody response in plasma vs. time profiles in 10 patients within the first 3 weeks after the beginning of the treatment. 108/102 ( ); 118/101 (
 ); 805/101 (
 ); 805/102 (
 ); 805/103 (
 ); 805/107 (
 ); 805/108 (
 ); 805/112 (
 ); 805/113 (
 ); 808/101 (
 )
)