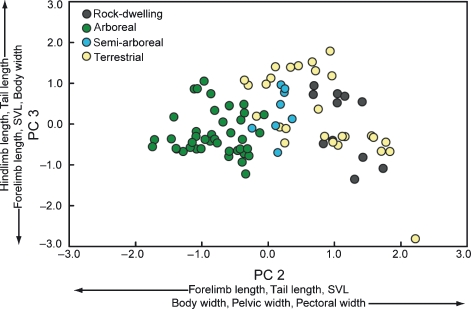
Fig. 2.
Scatterplots of agamid species in a morphospace defined by principal components 2 and 3. Color-coding for species’ habitat states is the same as in Fig. 1. Loadings of original variables on PCs are described for each axis. For brevity, we use ‘hindlimb length’ and ‘forelimb length’ to describe loadings on PCs when more than one element of that limb loads strongly on that axis. See Table 2 for details about PCA.

