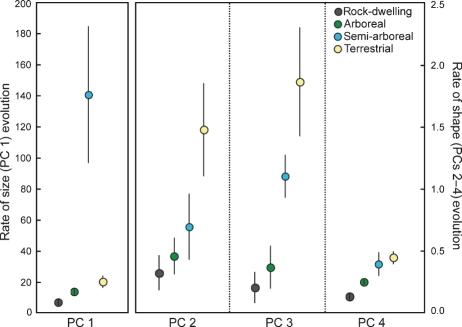
Fig. 3.
Model-averaged estimates for the rates of PC evolution in rock-dwelling (grey), arboreal (green), semi-arboreal (blue) and terrestrial (yellow) lineages. Point estimates are means of rate estimates from the 10 multiple-rate models and have been weighted by Akaike weights. Error bars are standard errors, representing uncertainty in habitat and phylogenetic reconstructions. Note that the y-axis for PC 1, an axis of size variation, is different from the y-axis for PCs 2, 3 and 4, which describe shape.

