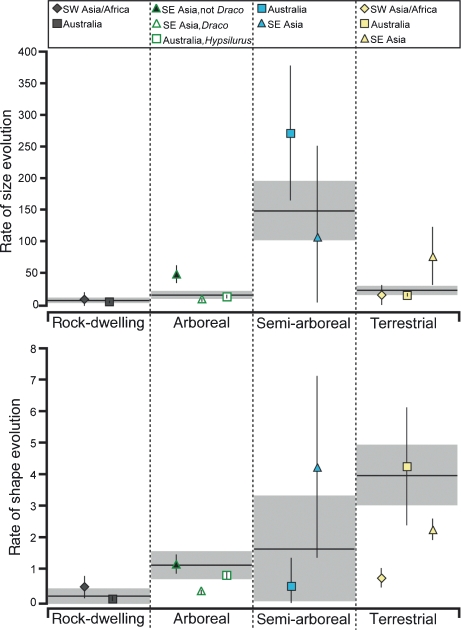
Fig. 4.
Rates of size and shape evolution for each habitat category estimated within the major agamid clades. Point estimates for the rates of size evolution are means of estimates for the rates of PC 1 evolution across the 500 habitat reconstructions, and estimates for the rates of shape evolution are sums of the mean rate estimates for PCs 2, 3 and 4. Error bars are standard errors for the rate estimates across the 500 reconstructions. Shapes correspond to clade identity (see Fig. 1): diamonds are southwest Asian/African lineages, triangles are southeast Asian lineages, and squares are Australian lineages. Horizontal lines represent rate estimates for all Agamidae (based on the full, four-rate Brownian model), and grey boxes represent ± one standard error taken across reconstructions.

