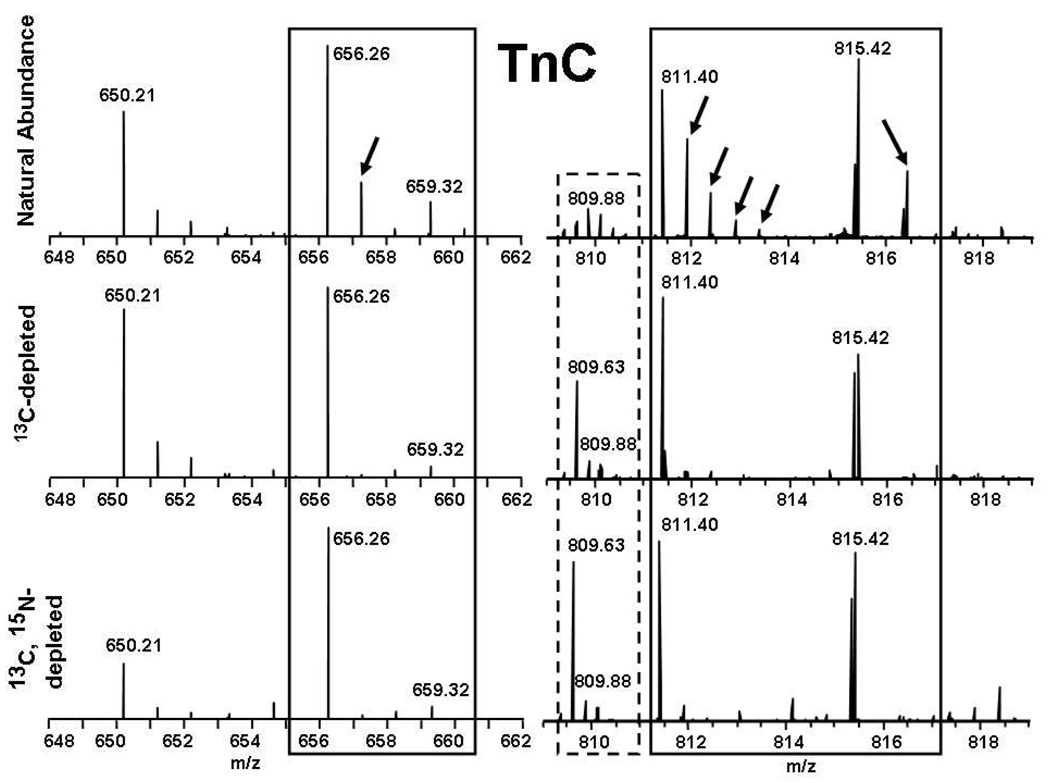
Figure 2.
Positive-ion ESI 14.5 T FT-ICR mass spectra for various peptides generated by protease XIII digestion of natural abundance (top), singly depleted (middle), and doubly depleted TnC (bottom). The peaks delineated by the rectangles represent fragment ions that belong to the digested protein TnC, whereas the species with monoisotopic m/z 650.21 is an autolysis product of the protease (see text). Note the increased abundance of the monoisotopic peak of the distribution (dashed reactangle).

