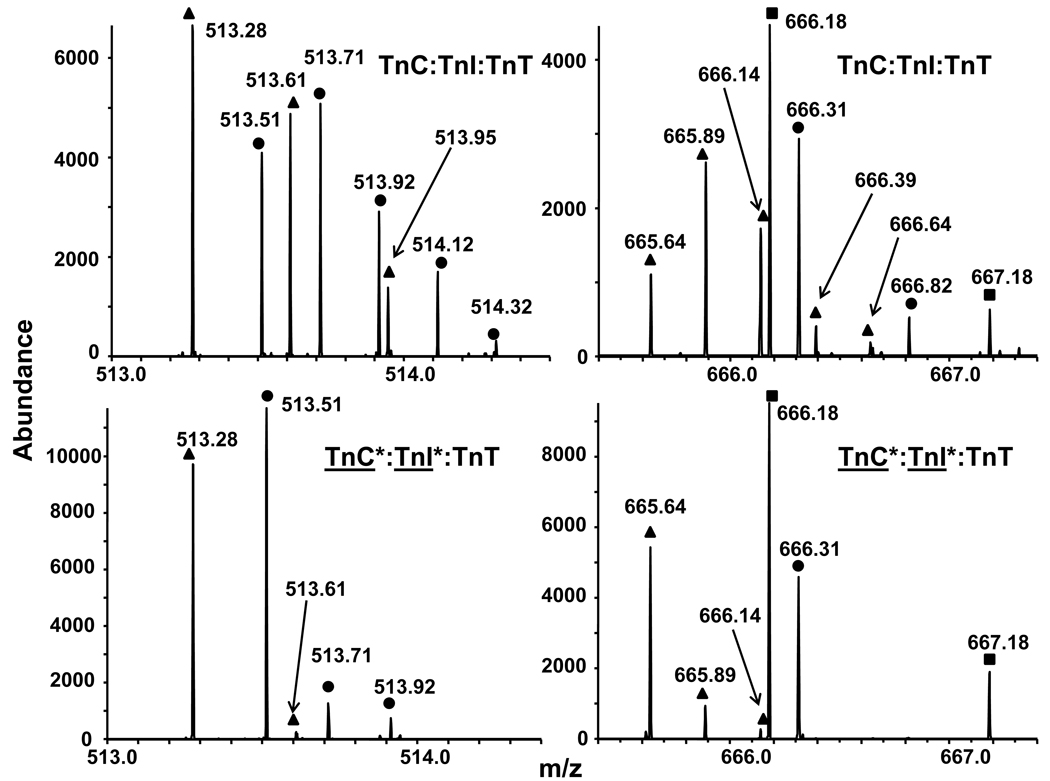
Figure 6.
Mass spectral segments for proteolytic peptides from TnC:TnI:TnT. Top: All three subunits are at natural abundance. Bottom: Subunits TnC and TnI have been isotopically depleted. The assignment of the distributions from the natural abundance complex (top: circles, squares, and triangles) is greatly facilitated from the much simpler assignment for the isotopically depleted peptides (bottom: circles and triangles only).

