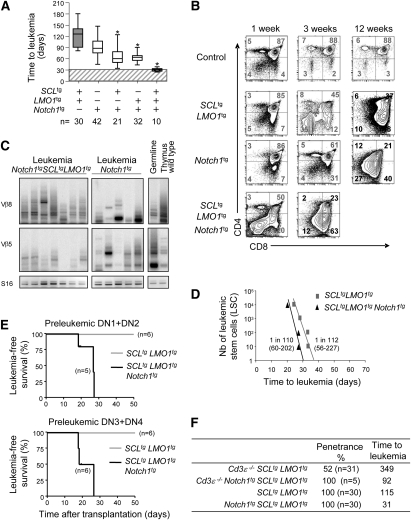
Figure 4.
Genetic interaction between SCL, LMO1, and a hyperactive Notch1 allele in leukemogenesis. (A) Survival analysis of SCLtgLMO1tg, Notch1tg, Notch1tgSCLtg, Notch1tgLMO1tg, and Notch1tg SCLtgLMO1tg mice. Results are presented as in Figure 2A ([*] P < 0.001 as compared with SCLtgLMO1tg mice). Cohorts of n mice were analyzed per genotype. (B) Preleukemic and leukemic phenotypes of Notch1tg and Notch1tgSCLtgLMO1tg mice. Representative flow cytometry analysis of thymocytes was performed at the indicated times as in Figure 2B. (C) Oligoclonal T-cell expansion detected by PCR analysis of Tcrβ gene rearrangements in Notch1tg and Notch1tgSCLtgLMO1tg tumors. Genomic DNA was amplified by PCR with primers for specific variability segments of Tcrβ. Shown is germline configuration, rearrangements in wild-type thymus, and seven independent Notch1tgSCLtgLMO1tg and five independent Notch1tg tumors. (D) Leukemic cells from SCLtgLMO1tg and Notch1tg SCLtgLMO1tg were transplanted through limiting dilution in Rag1−/− mice. Shown is the time to leukemia after transplantation of the indicated numbers of LSC equivalent. LIC frequency (Range LIC ± SE) for the indicated genotype was calculated by applying Poisson statistics using the Limit Dilution Analysis software (Stem Cell Technologies). (E) Purified preleukemic thymocyte populations from 7-d-old SCLtgLMO1tg and Notch1tgSCLtgLMO1tg mice were transplanted into sublethally irradiated coisogenic Pep3B mice at a concentration of 3 × 10⁴. Shown are the numbers of mice presenting T-ALL 4 wk post-transplantation over the total numbers of transplanted mice. (F) Penetrance and median time to leukemia for SCLtgLMO1tg, Notch1tg SCLtgLMO1tg, Cd3ɛ−/− SCLtgLMO1tg, and Cd3ɛ−/−Notch1tgSCLtgLMO1tg.

