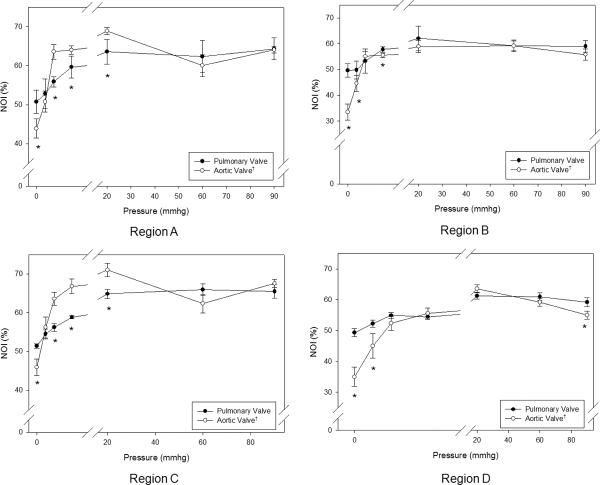
Figure 4.
Regional changes (as defined in Figure 3) in NOI values for all commissure regions with transvalvular pressure for both the PV and the AV. The PV had a higher NOI than the AV. The PV displayed gradual realignment up to 20 mmHg, whereas the AV experienced a drastic increase in alignment up to 4 mmHg, and both valve approached approximately the same NOI at 90 mmHg. Region C, Region B, Region C, and Region D all displayed the same trends as Region A. Also, note that for all transvalvular pressures, the paired regions on symmetric sides of the cusps (A–C and B–D) showed approximately the same responses for all pressures.* indicates a p value of < 0.05.

