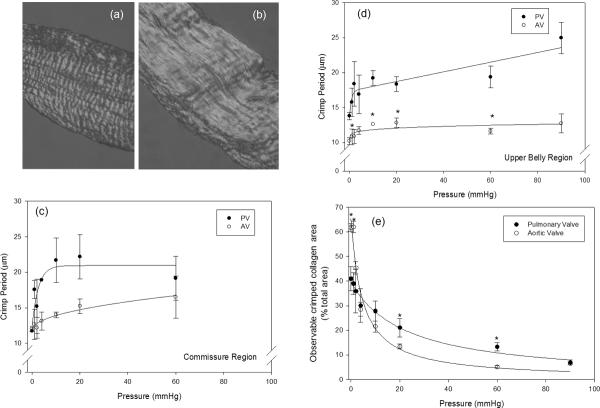
Figure 7.
Representative images of the PV collagen fiber crimp structure (a) at 0mmHg and (b) at 10 mmHg, showing marked fiber straightening crimp with pressure. (c) Changes in crimp presented as the percentage of the total image area at each pressure, showing that the decrease crimp for the PV was gradual, whereas the decrease in the amount of crimp for the AV was drastic between 0 and 4 mmHg. In (d) and (e) are the measured PV and the AV crimp period of the commissure and belly regions, respectively. Between 0 and 20 mmHg and 0 and 4 mmHg of pressure for the PV and the AV, respectively, the undulations continually began to diminish, with minimal change thereafter. (* indicates a p value of < 0.05).

