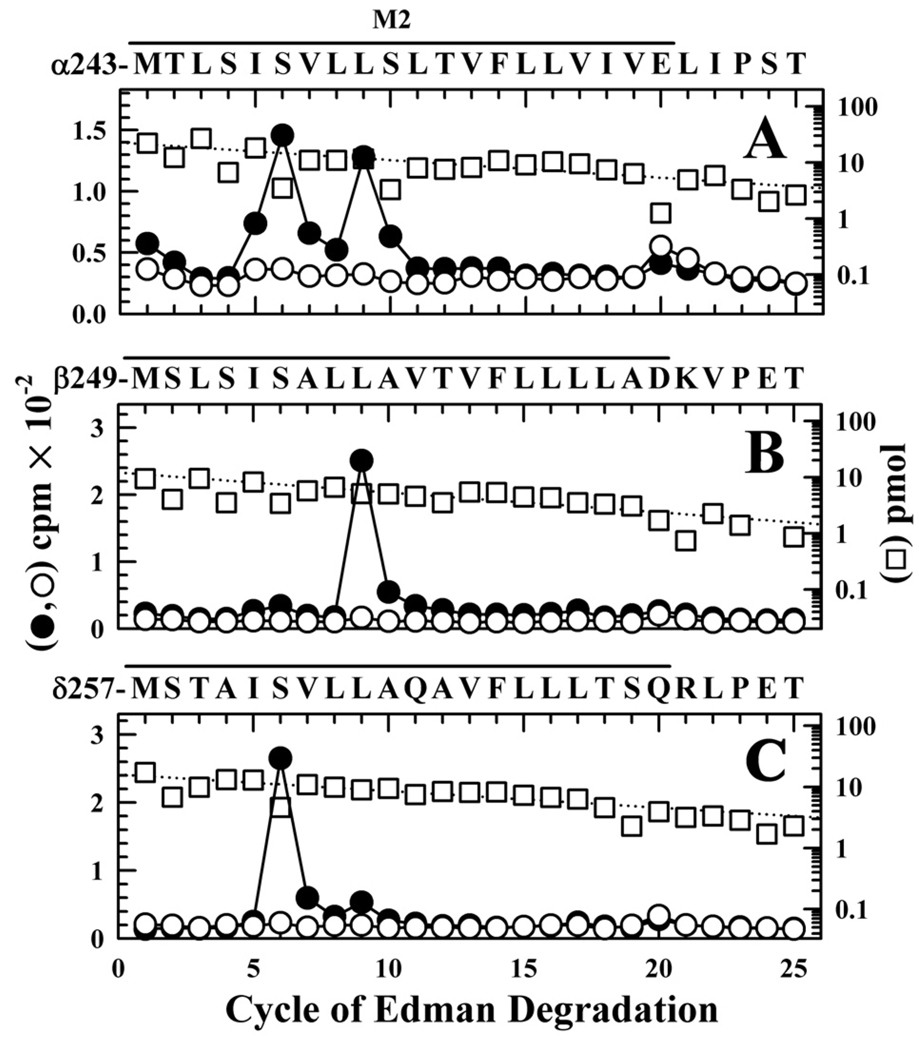
Figure 7. [3H]CPZ photolabeling in the M2 ion channel in the presence of α-BgTx.
3H (●, ○) and PTH-amino acids (□) released during sequence analysis of fragments beginning at the N-termini αM2 (A), βM2 (B), and δM2 (C), isolated from nAChR-rich membranes photolabeled with 1.7 µM [3H]CPZ after equilibration with 10 µM αBgTx in the absence (●) or presence (○, □) of 100 µM tetracaine. Labeled subunits were separated by SDS-PAGE and processed as in Figure 5 to isolate peptides beginning at the N-termini of the M2 segments. A, The fragment beginning at αMet-243 was the primary sequence (I0 = 23 pmol −(□) and 17 pmol +tetracaine), along with α subunit fragments beginning at αSer-173 (~12 pmol), αHis-186 (~18 pmol), and αTyr-277 (~2 pmol), as well as EndoLys-C (Gly-1, ~8 pmol) and a V8 protease peptide (Val-180, ~5 pmol). (10,200 (●) and 7,820 (○) cpm sequenced). B, The primary sequence began at βMet-249 (I0 = 12 pmol −(□) and 10 pmol +tetracaine), with any secondary sequence beginning at <10% that level. (1,900 (●) and 960 (○) cpm sequenced). C, The only sequence detected began at δMet-257 (I0 = 15 pmol −(□) and +tetracaine; 5,300 (●) and 2,700 (○) cpm sequenced). For all sequencing runs, the efficiencies of photolabeling (cpm/pmol) associated with the peaks of 3H in cycles 5, 6, 9, 16, 17, or 20 are quantitated in Table 2.

