Figure 3.

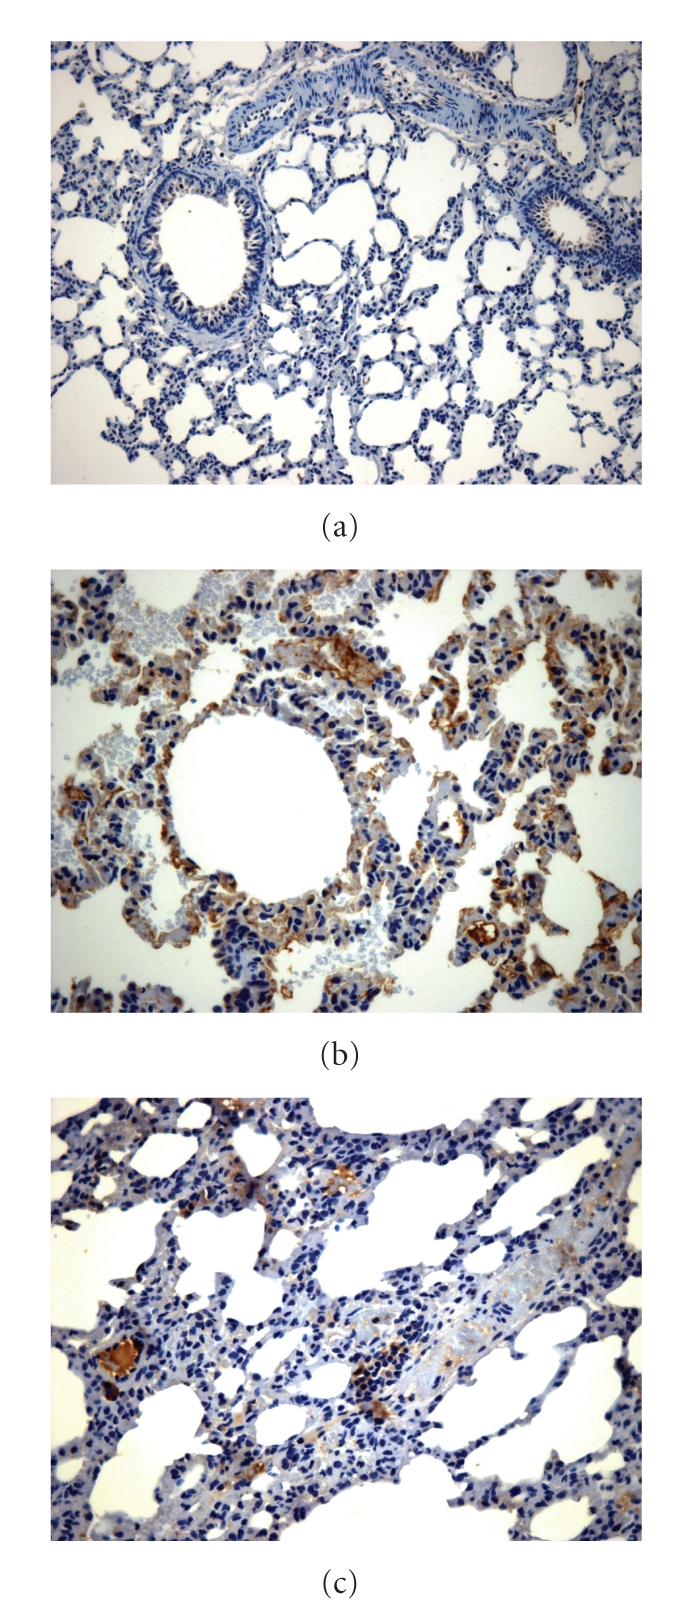
iNOS immunohistochemistry in lung tissue. Magnification 400×: There was no staining in the control group (a); reduction in the treated group (b) versus DM (c).

iNOS immunohistochemistry in lung tissue. Magnification 400×: There was no staining in the control group (a); reduction in the treated group (b) versus DM (c).