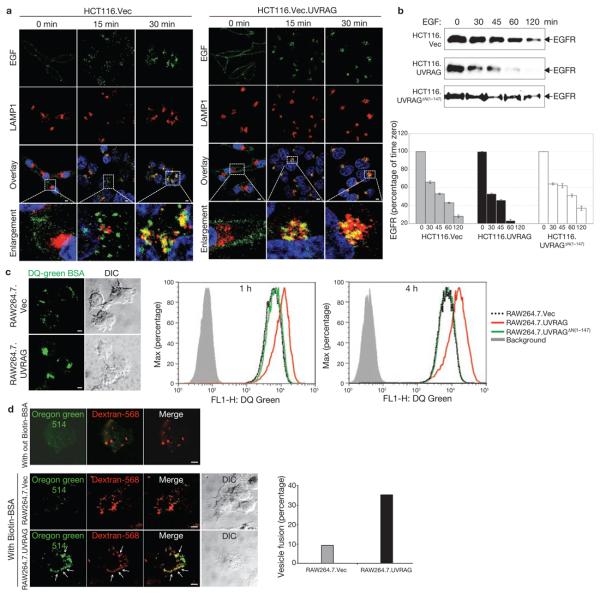
Figure 7. UVRAG promotes endocytic trafficking.
(a) EGF-stimulated endocytosis and post-endocytic trafficking. Uptake of Alexa Fluor 488–EGF (green) by HCT116.Vec (left panel) and HCT116.UVRAG (right panel) cells was followed by confocal microscopy. At the indicated times, cells were fixed and stained with antibodies to LAMP1 (red), and Topro-3 (blue, to stain the nucleus). Magnified images of the insets (fourth row) highlight trafficking of EGF towards LAMP1-positive structures. (b) EGFR degradation. HCT116. Vec, HCT116.UVRAG and HCT116.UVRAGΔN(1–147) cells were treated with EGF (200 ng ml−1) at 37 °C for the indicated times. WCLs were subjected to immunoblotting with an anti-EGFR antibody. EGFR at each time point was quantified and indicated as a percentage relative to that at time zero (right panel; data are mean ± s.e.m., n = 3). (c) DQ-green BSA dequenching assay. Representative confocal microscopy images of DQ-BSA proteolysis (left panel) and flow cytometry analysis (right panel) of RAW264.7 cells expressing an empty vector (RAW264.7.Vec; dotted black line), wild-type UVRAG (red line) or UVRAGΔN(1–147) mutant (green line) loaded with 10 μg ml−1 DQ green–BSA for the indicated times. Background (grey line) represents samples without the BSA load. (d) Effect of UVRAG on endosome fusion. RAW264.7.Vec and RAW264.7.UVRAG cells were pulse-labelled with Oregon green 514–avidin and dextran-568 for 10 min and chased for 30 min. Cells were then labelled with biotin–BSA for 10 min, and processed for confocal microscopy (left panel). In the absence of biotin–BSA, Oregon green 514–avidin showed very low fluorescence (first row of confocal image). The percentage of dextran-568-labelled endosomes with visible Oregon green staining (denoted by arrows in the left panel) was calculated from approximately 20 different cells in 2 independent experiments (mean, right panel). Scale bars, 5 μm. The raw data of the immunoblots in b are shown in the Supplementary Information, Fig. S6.

