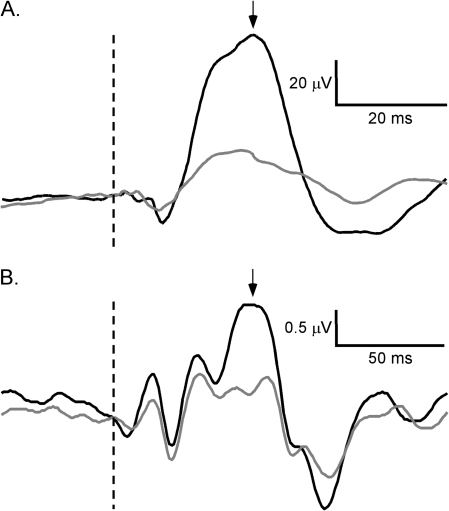
Figure 1.
Grand averages of mouse (A) and human (B) event-related potentials showing the responses to S1 (black) and S2 (gray). Maximum positive deflections in (A) and (B) represent the P20 and P50 components, respectively. Dotted lines indicate stimulus onset and arrows indicate P20 and P50 components.

