
Figure 2.
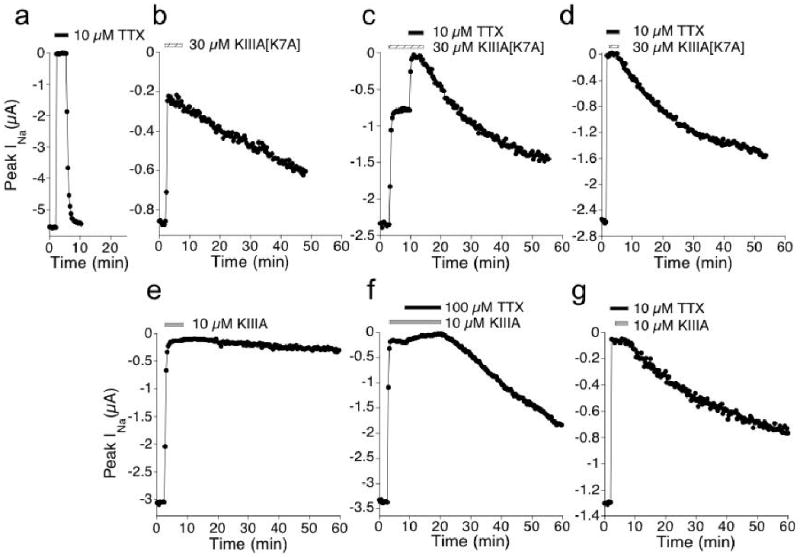
TTX blocks residual INa that persists in saturating concentrations of KIIIA[K7A] or KIIIA and accelerates the rate of peptide-washout. Example plots of peak INa recorded from oocytes during exposure to: TTX (a); KIIIA[K7A] (b); KIIIA[K7A] followed by KIIIA[K7A]+TTX (c); TTX followed by TTX+KIIIA[K7A] (d); KIIIA (e); KIIIA followed by KIIIA+TTX (f); and TTX followed by TTX+KIIIA (g). Different oocyte was used in each of panels b to g, where previous exposure to 10 μM TTX obliterated INa (not shown, but as in a). Presence of 10 or 100 μM TTX is indicated by black bar, 30 μM KIIIA[K7A] by hatched bar, and 10 μM KIIIA by gray bar. In all cases, except e, recovery of INa during toxin-washout could be fit by a single exponential time course (koff values are listed in Table 1). Test pulses were applied at 20 s intervals (see Methods).