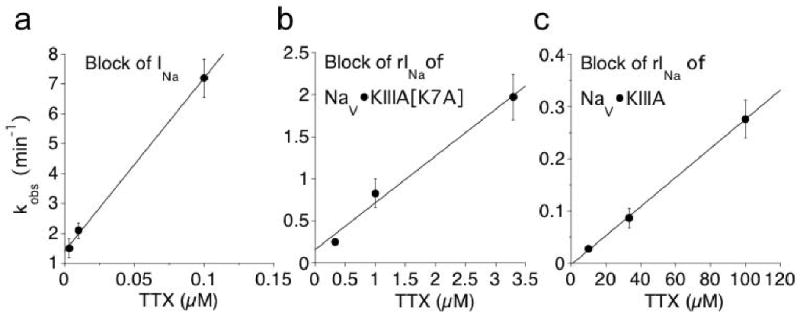
Figure 3.

Rate of TTX-block of control INa (a), residual INa in 30 μM KIIIA[K7A] (b), and in 10 μM KIIIA(c) differ radically from each other (note different time scales). Time course of block of rINa by various [TTX], each fit to a single exponential (not illustrated), provided the observed rate constants (kobs). Plots show kobs for different [TTX]. Relative timing of the exposure to toxin was essentially as in Fig. 2a for NaV, Fig. 2c for NaV•KIIIA[K7A], and Fig. 2f for NaV•KIIIA. Linear regression slope, providing apparent kon, was 58 ± 5.3 μM-1min-1 (a), 0.56 ± 0.08 μM-1min-1 (b), and 0.003 ± 0.0004 μM-1min-1 (c).
