
Figure 4.
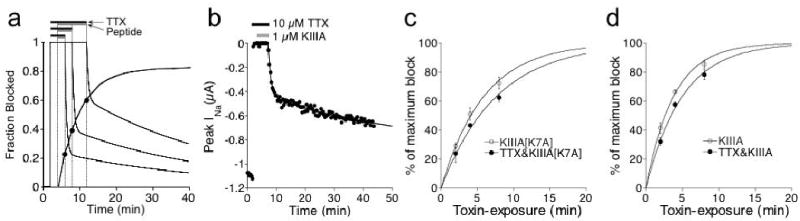
Apparent on-rate of peptide binding in the presence of TTX was only slightly slower than the rate of block by peptide in the absence of TTX. Level of peptide bound to NaV1.2 in the face of 10 μM TTX was determined by the amount of persistent-block following washout of both toxins. (a) Protocol used to determine level of persistent-block by peptide (i.e., formation of NaV•TTX•peptide). Results from series of three hypothetical experiments are superimposed: oocyte was exposed to TTX for 2 min. followed by exposure to TTX + peptide for 2, 4, or 8 min before washing out both toxins (black bars represent presence of TTX, and gray bars, TTX + peptide). In each case, the washout curve was fit to a double exponential, of which the span and koff of the faster and slower components represent the recovery from block of NaV•TTX and NaV•TTX•peptide, respectively. The closed circles represent the span of the slower component and correspond to the closed circles in c and d. (b) Representative results showing peak INa during exposure to, and following washout of, TTX and KIIIA (black and gray bars, respectively). (c, d) Time course for the formation of NaV • TTX•peptide (closed circles), estimated by the persistent-block produced by 1 μM peptide as described in a for different durations of simultaneous-exposure to TTX+peptide (cf., closed circles in a), compared with the formation of NaV • peptide (open circles) simply measured by block produced by 1 μM peptide alone. Data were fit to single exponential curves (solid lines). kobs for formation of NaV • KIIIA[K7A] and NaV • TTX • KIIIA[K7A] was 0.17 ± 0.006 and 0.13 ± 0.006 min-1, respectively (c). kobs for formation of NaV • KIIIA and NaV •TTX • KIIIA was 0.27 ± 0.01 and 0.20 ± 0.008 min-1, respectively (d).