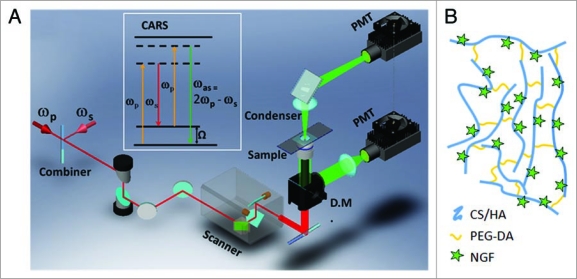
Figure 1.
Experimental approaches. (A) Schematic drawing of a CA RS microscope. The inset window shows the energy diagram of CA RS. ωp: pump frequency; ωs: Stokes frequency; DM: dichroic mirror; PMT: photomultiplier tube. (B) Schematic of the composition of the gel scaffolds for the growth of DRG neurites. The figure is not to scale.

