Figure 5.
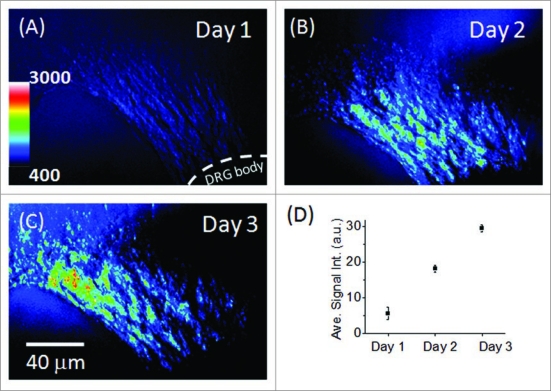
Analysis of CA RS signal of neurite growth: (A–C) In situ neurite growth in a 0.5% HA matrix on day 1 to day 3. (D) Relative density of neurites on day 1 through day 3. The analysis was performed according to the intensity in the 8-bit gray-scale 3-D images. Each data point represents the average number of the intensity results analyzed according to areas of three days (method).

