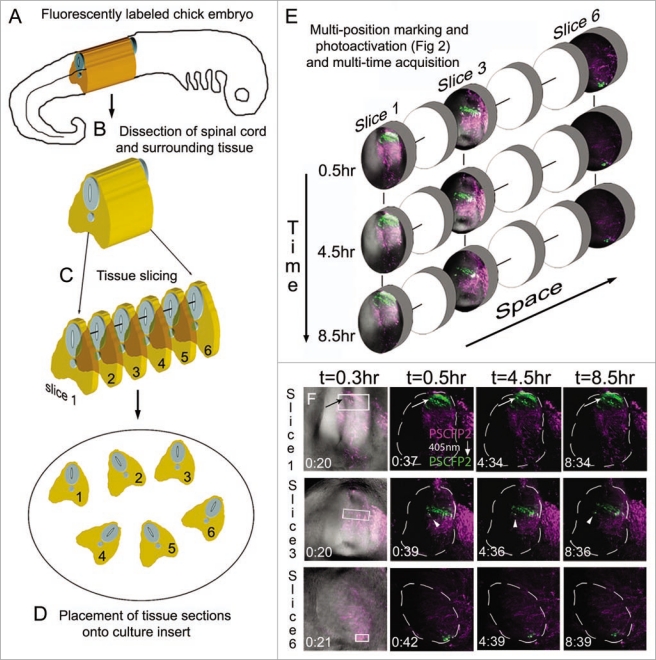
Figure 3.
Multi-position photoactivation and multi-time acquisition. (A) A typical fluorescently labeled (PSCFP2) chick embryo at day 4 with (B) the spinal cord removed and (C) cut into slice preparations that (D) are laid onto a culture insert. (E) Within each tissue slice, a region of interest is photoactivated and set up for time-lapse acquisition in a sequential manner, with three typical slice data shown at 0.5 hr, 4.5 hr and 8.5 hr intervals. Individual photoactivated cells are identified by arrows (to show maintenance of photoactivated fluorescence signal) and by arrowheads (to show changes in cell direction). Each photoactivated region of interest is approximately 50 um in height.

