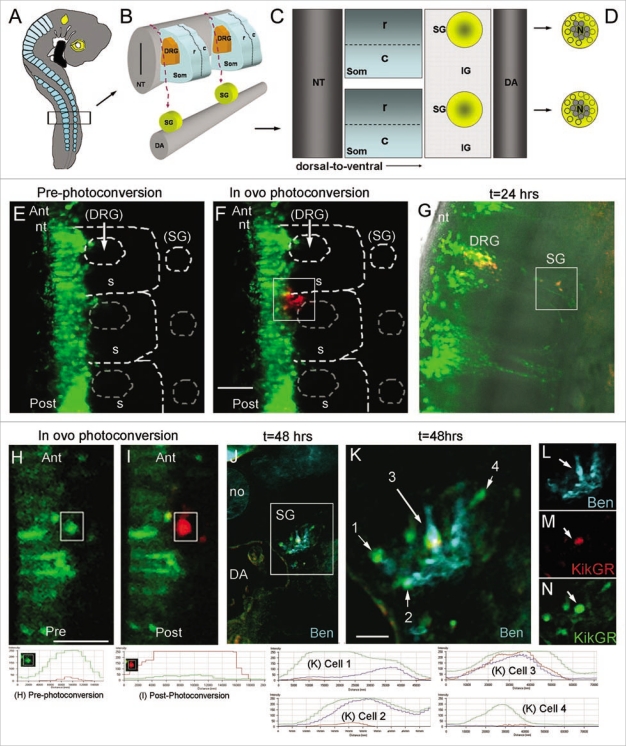
Figure 4.
Towards cell tracing during organogenesis: determining the fates of early versus late migrating sympathetic precursor cells. (A) Schematic of E3 chick embryo with boxed region indicating region of interest for photoactivation cell labeling of premigratory neural crest cells. (B) Schematic of typical trunk neural crest cell medial to ventral migratory pathway through the presumptive dorsal root ganglia (DRG) to reach the sympathetic ganglia (SG) adjacent to the dorsal aorta (DA). (C) Sagital view of the trunk structures including the rostral (R) and caudal (C) somite and the SG and inter-ganglionic region (IG). (D) Schematic of the SG that form into a neuronal core (N), grey shaded area, and progenitor neural crest cells, yellow area. (E) In ovo image of KikgR unphotoactivated (green) construct expressed by premigratory neural crest cells in the neural tube, and beginning to emerge into the rostral somite. (F) In ovo image of post-photoactivation (red) of neural crest cells within the highlighted box, showing a group of cells that recently emerged from the neural tube beginning their medio-ventral migration path to populate either the dorsal root or sympathetic ganglia. Unphotoactivated cells remained green. (G) Whole embryo explant image of where the photoactivated cells migrated and localized. From the initial group of photoactivated cell, a portion stopped in the dorsal root ganglia and some continued ventral to give rise to the sympathetic ganglia. (H and I) pre- and post-in ovo photoactivation of early neural crest cells emerging from the neural tube (within box). (J) Embryo after 48 hours from (I), transverse sectioned and stained with Ben (blue). (K–N) Higher magnification of boxed region in (J). Line scan intensities for cells in part (H, I and K) are shown at the bottom of the figure. Pre-photoconversion levels show GFP intensity above 250 AFU and RFP channel below 50 AFU. Post-photoconversion shows an increase in RFP intensity above 250 AFU and a decrease in GRF intensity to below 50 AFU. Cells from 1 K include cell 1 = unphotoconverted non-neural cell (green only), cell 2 = unphotoconverted neural cell (Green and Blue), cell 3 = photoactivated neural cells (Red, Blue and Green-this cell has green fluorescence after 72 hours post-photoconversion because the PSCFP will continue to be made in cells that express it whether it is photoconverted or not), cell 4 = unphotoconverted non-neural cell (green only). nt, neural tube; DRG, dorsal root ganglia; SG, sympathetic ganglia; DA, dorsal aorta; no, notochord.

