
Figure 7.
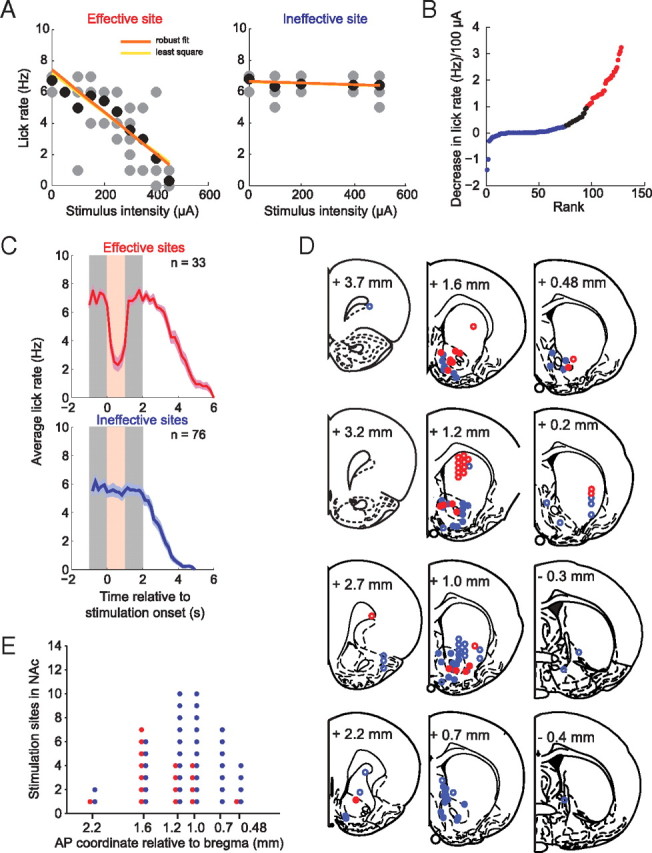
Stimulation-induced disruption of licking is most effective in NAc and dorsal striatum. For the purpose of illustration, all stimulation sites (n = 129) are collapsed in one hemisphere. Only one electrode pair was tested at a time. A, Examples of input–output relationships of an effective site (red, left panel) and an ineffective site (blue, right panel) of lick disruption. The gray dots represent the per-trial lick count at a given intensity, and the black dots represent the average of all lick counts at that intensity. The orange linear regression line was obtained with the robust fit method, and the yellow regression line, with the least square method. B, Recordings ranked by the reduction in lick rate (∼7 Hz in the absence of stimulation) per 100 μA of stimulation current. This was used as a measure of lick disruption efficacy. Stimulation pairs in which the decrease was ≥1 are shown in red (effective sites), and those in which the decrease was ≤0.25 are shown in blue (ineffective sites). Both thresholds were set arbitrarily. C, Average licking time course (and SEM) of effective (red) and ineffective sites (blue), time-locked to the stimulation onset. Stimulation (200–250 μA) (shown in light red) was always delivered during sucrose consumption (shown in gray) (for details, see Materials and Methods). The number of stimulation–disruption relationships is indicated in each plot. D, Anatomical location of stimulation sites of effective (red) and ineffective (blue) sites, shown in coronal outlines modified from the atlas of Paxinos and Watson (1998). The open circles are sites outside of the NAc. E, Distribution of effective (red) and ineffective (blue) stimulation sites in the NAc as a function of AP position. Note that effective sites have a more rostral distribution than ineffective sites in NAc.