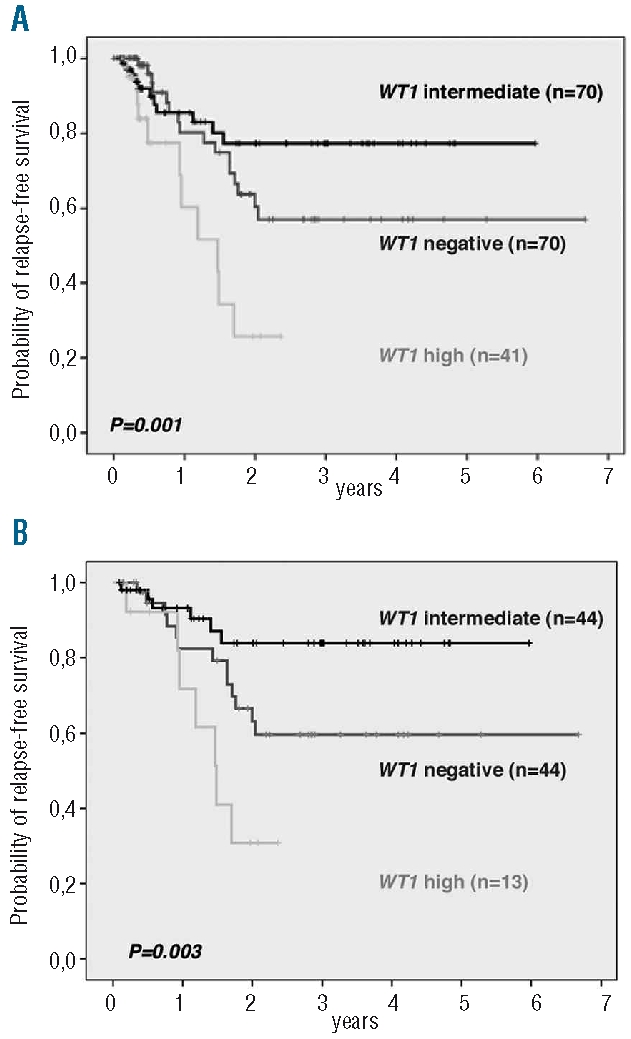
Figure 2.

Relapse-free survival of adult T-ALL patients with respect to WT1 expression. (A) Overall T-ALL cohort. (B) Thymic T-ALL subgroup. The overall P values are given. Comparisons between the separate WT1 expression groups were as follows: 2A: WT1 intermediate versus WT1 negative: P=0.26; WT1 intermediate versus WT1 high: P=0.003; WT1 negative versus WT1 high: P=0.002. 2B: WT1 intermediate versus WT1 negative: P=0.055; WT1 intermediate versus WT1 high: P=0.054; WT1 negative versus WT1 high: P=0.001.
